The Case For $3465 Gold
Posted by Shane Jennings on
Seeking Alpha
Jul. 2, 2020 10:07 AM ET
What's A Fair Value For Gold?
In my opinion, one way to value gold is to use reference points. Since gold is an ancient currency, I'll compare the gold price to the size of the monetary base (M2).
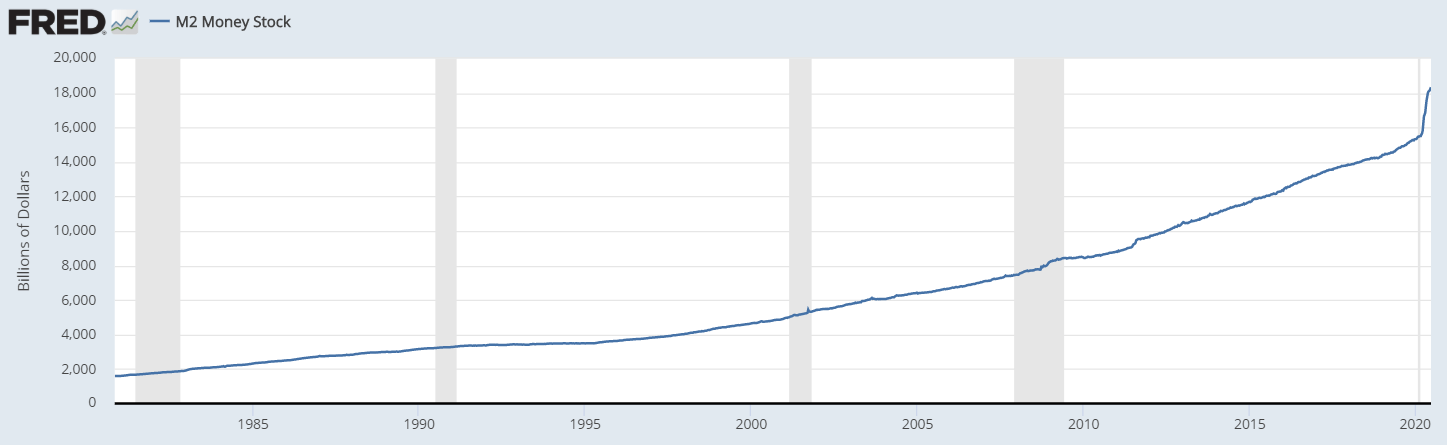
As you can probably imagine, money supply in the US grows consistently over time. The rate of growth has also risen more recently. Between February 3, 2020 and June 15, 2020, the amount of M2 money has risen by almost $3 trillion. In comparison, it took about 4 years for the last $3 trillion to accumulate. The chart below shows the M2 money supply since 1980.
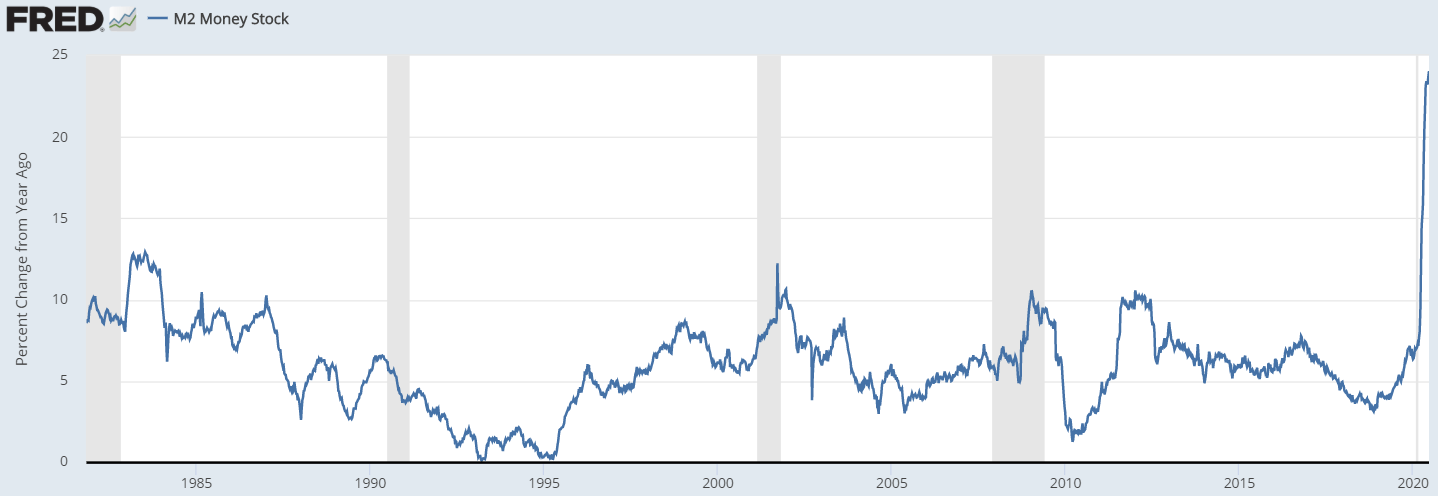
The following chart better highlights the speed of recent M2 money supply expansion by showing year-over-year % growth. The rate of growth declined from the early 1980s to the mid-1990s and then steadily rose again to hover between 5-10% until now. As of June 15, 2020, the year-over-year M2 growth exploded to 24%.
The next chart shows the gold price during the same period. Today, as gold approaches all-time highs reached in 2011, you'd be excused for thinking gold looks expensive. However, the story changes once you anchor gold to M2 money supply.

Between 1980 and 2001, gold was in a secular bear market. There are several explanations, including a productivity boom, declining geopolitical tensions and high central bank credibility. Since gold bottomed in 2001, the world has changed.
After 2001, Gold rallied as many of the previous headwinds reversed to become tailwinds. Gold peaked in 2011 briefly breaking through $1900 per ounce, ending the secular bull market. Since 2011, the metal has formed a classic 'saucer' pattern, declining to about $1000 by 2015 and then recovering to where it is today (approximately $1780 per ounce). According to technical analysts (I am not one), this pattern might suggest gold has further upside and that the secular gold bull market has resumed.
Comparing the historical gold price to the M2 money supply provides further support for the bullish argument and can be one of several different measures to assign a target value for gold.
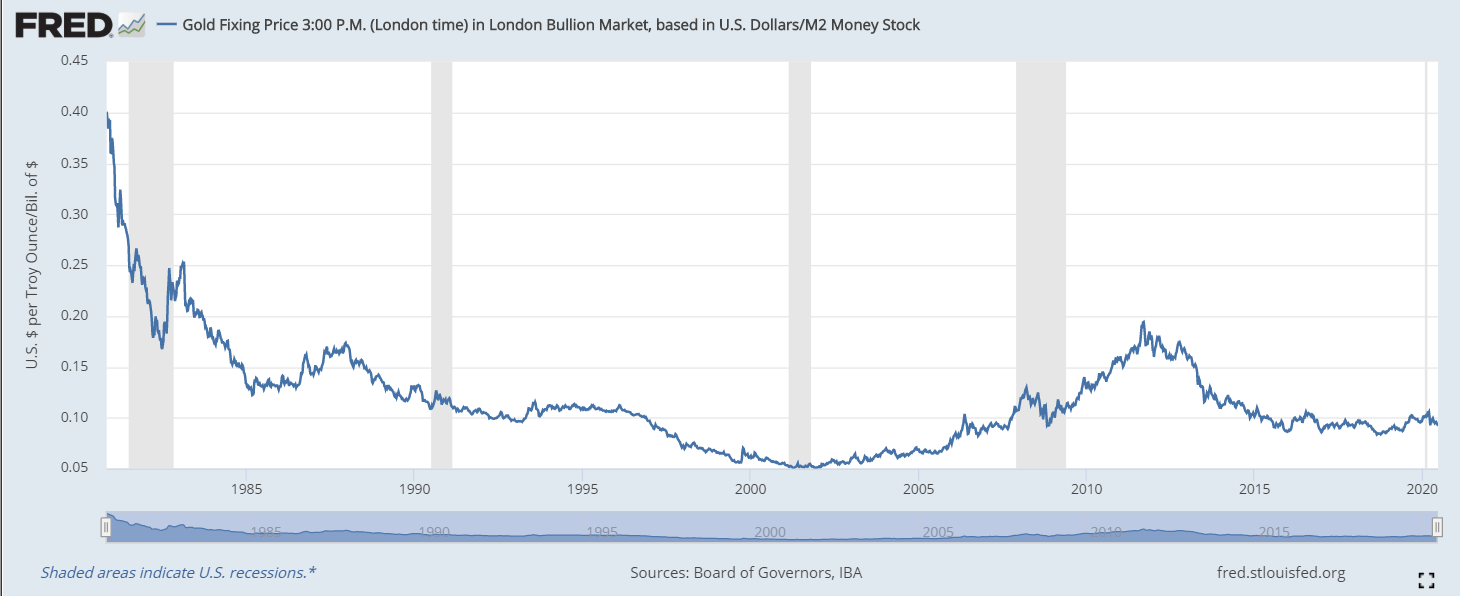
The chart below shows the gold price as a fraction of M2 money supply. The calculation uses the price of one ounce of gold compared to billions of M2. For example, if gold was at $1000 per ounce and money supply at $10,000 billion (aka $10 trillion), the ratio would be 0.1.
That ratio reached a historical low of 0.052 on September 3, 2001. This marked the start of gold's secular bull run, which ended on September 5, 2011 at a ratio of 0.19. The ratio has subsequently declined to hover just under 0.10 for the past five years. This suggests that gold's price rise since 2015 is backed by an equivalent growth in money supply. As of June 15, 2020, the gold-price-to-M2 ratio sits at 0.09.
This of course raises the question: What is the appropriate gold-price-to-M2 ratio?
I don't think this can be answered by simply taking a long-term historical average. There are simply too many variables at play and this would oversimplify the calculation.
Instead, it might help to look at where the ratio sat during similar economic times.
It was the aftershocks and policy responses of the 2008 financial crisis that drove gold prices ultimately to $1900 in 2011. The economy was skipping from calamity to calamity, culminating in a European sovereign debt crisis in 2011. This plus continuously falling real yields on risk-free assets likely pushed investor emotions to the limit, driving them to gold.
Just like after the financial crisis, I think it's entirely reasonable to assume the Covid-19 economic crash will lead to similar numerous aftershocks over a few years. So investors are likely to once again place a premium on gold. If the gold-price-to-M2 ratio was to return to the 2011 level, that would imply a gold price of $3465 per ounce.
For now, one could argue that there is no premium on gold today vs. its recent bottom in 2015. Even though the price has risen, it is simply keeping up with growth of the monetary base. The ratio doesn't have to rise significantly for gold prices to rise significantly. Even a rise to 0.14 (halfway between the current ratio and the 2011 level) would drive gold to $2566 per ounce. That's a 44% gain.
I don't foresee a return to the bubble days of 1980 anytime soon - at that time the gold-price-to-M2 ratio was 0.40. A return to that ratio would imply a gold price of $7332 per ounce. A lot has to go wrong with the world for gold to reach that value, so I hope it never does. Remember, 1980 marked the end of a tumultuous decade that included high inflation, economic shocks, rising interest rates, poor stock performance and polyester leisure suits. Still, it's comforting to know that the 'insurance policy' exists in my portfolio.
Final Thoughts
The gold-price-to-M2 ratio is just one of many measures one should use to evaluate gold. Other measures might include gold as a fraction of GDP or total stock market value. One might also adjust for the growth in gold supply over time.
Furthermore, low/negative real interest rates (aka financial repression), central bank credibility and general monetary disorder are all important gold price drivers that must be considered when making a case for gold. This is outside of the scope of this article, however.
Some research suggests that many people would benefit from a 10%-20% allocation to gold. Some more, some less depending on personal circumstances.
Many investors prefer to buy physical bullion.